Ok I swear this is the last B+Tree chart, graph, or metric I’ll post… at least for a while. I wanted to hit new limits so I fired up 6 threads on my six-core and let them rip… After three hours I finally stopped the run to look at the results.
Each of the six threads had inserted over 34 million records, a total of over 200 million records inserted in 3 hours averaging over 18k inserts per second. The data file had reached 5.79 GB (6,221,824,032 bytes). I guess that isn’t too bad considering I was using my slow 2tb WD caviar green (I didn’t want to thrash my SSD). Opening the file doesn’t do much other than to read the first block, from a cold start it took 62ms. The first thousand random seeks took an average of 10ms and thereafter settled in at around 9ms. Sequential scans of 1000 keys at a random offset takes about 500ms averaging .5ms each.
The following is a graph of one thread (all 6 near identical) showing the time in seconds (vertical) and total records inserted in millions (horizontal). Obviously the point being made here is that the line is straight :)
Time / Records
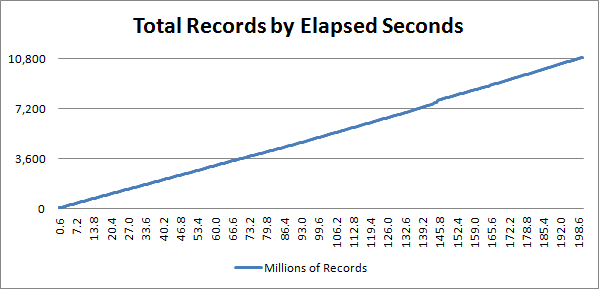
If you are wondering why these numbers don’t line up with the B+Tree benchmarks previously posted there are two reasons. First I totally screwed up the multi-threaded test for those numbers. The second difference was the amount of data/record size. The above graph shows inserts of an Int32 key and a Guid value or 20 byte records. The benchmark used a Guid key on a 100 byte value or 116 byte records. The major reason for reducing the record size was to improve throughput so I could target a larger number of records.